NBA Defensive Shot Profiles
Where do opponents shoot with strong defenders on the floor?
The problem with all-in-one defensive metrics
NBA defense is complicated, really complicated. We can and have learned to count a lot of things on offense, but defense is incredibly difficult to quantify. The current metrics feel incomplete to iffy at best. Defensive ratings are tied heavily to your teammates, signaling that defense is largely a full team effort. Querying NBA’s stats this season’s defensive rating for players who have played more than 50 games this season and average over 12 minutes a game, you don’t see many DPOY candidates or all defense team candidates1.
GP2 makes sense. Timelord makes sense. Any starting Celtic makes sense. But Steph Curry? Above DPOY candidates Mikal Bridges and his own teammate, Draymond Green?
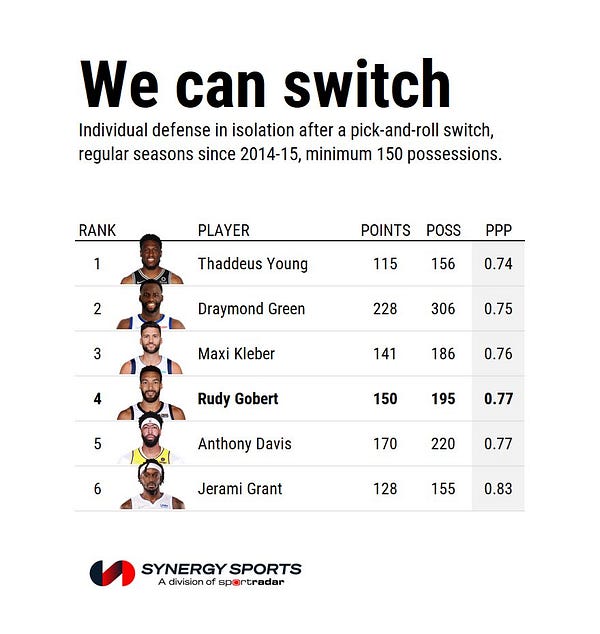
Thankfully, we have some great advanced metrics such as this beautiful table by Todd Whitehead:
Side note: who knew Maxi Kleber was such a great switch defender?
Cody Houdek and Ben Taylor tried to grapple with how to credit NBA players for proper defensive contributions in their recent podcast2. They sounded tortured. So tortured. Cody usage of the word “nebulous” may have reached 0.8 uses per sentence when describing how to look at defense in quantitative metrics. Ben questions how well shots challenged at the rim indicates a strong defender. Add in blocks, and we still only have a partial picture. Kirk Goldsberry previously dubbed “The Dwight Howard effect” as shots completely deterred in a research paper. So how do we measure something that doesn’t happen?
My answer is that shots still occur; they’re just allocated somewhere else. Theoretically, the strong rim defenders are pushing shots further away from the rim. The primary value of a shot blocker is removing as many of easiest shots as possible. Those layups become floaters. The floaters become mid-range jumpers. Or everything ends up as a three. They should generally be further away. But how far away are shots deterred? Does it matter depending on the player?
I’ll try to answer these questions by seeing how shot distance and field goal percentages compare to the league and among each player’s own team.
The Data
Using nba_api3’s wonderful live stats library, I collected the entire season’s play by play per game and accessed the shot distance of every shot taken. In a rudimentary attempt to exclude garbage time, I removed all plays after the 8 minute mark of the 4th quarter where a lead was 20 or above. Next, I isolated opponent shots when certain players were on the court, mostly anecdotally strong defensive players and Nikola Jokic. I also compared a player’s effect to the league rates and his respective team’s rates.
The Results
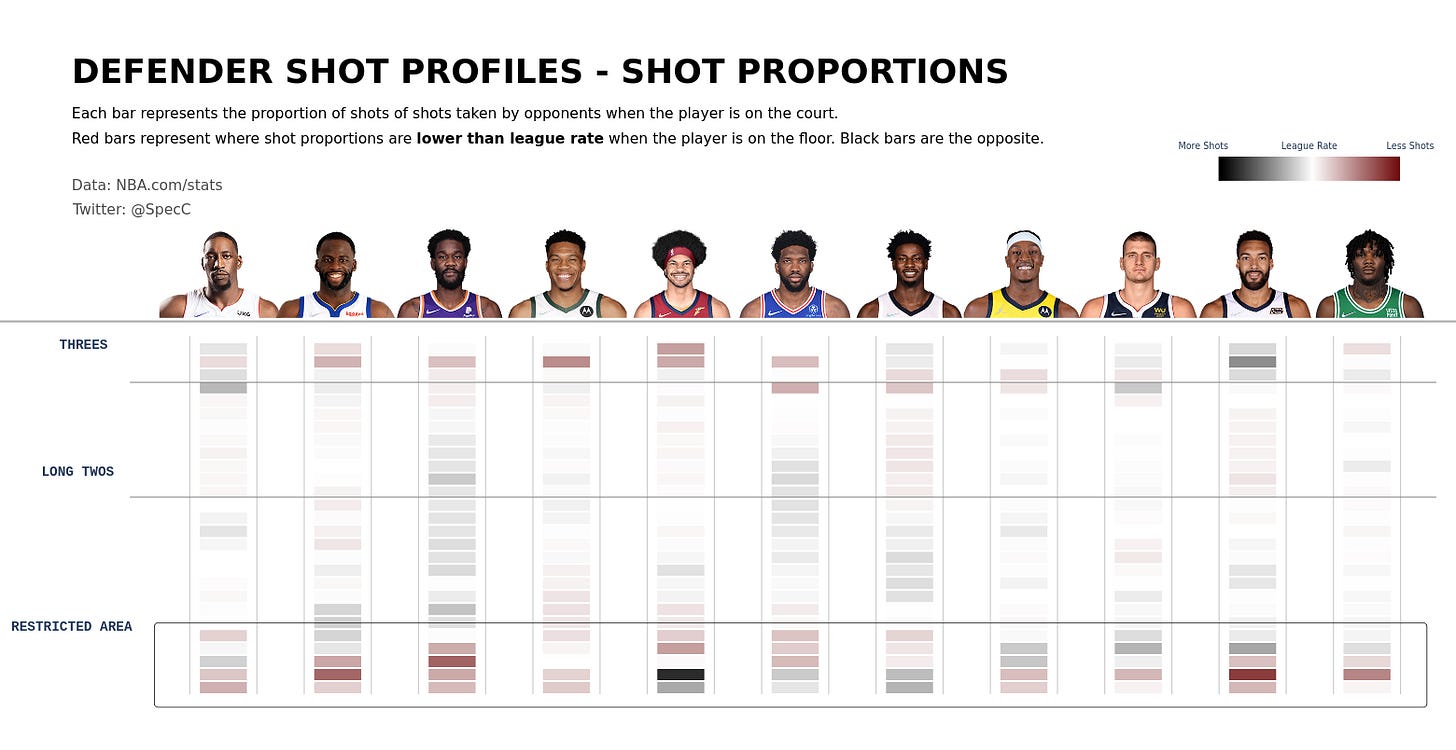
Taking inspiration from @_jphwang’4, I created these “shot-blots” to generate defender shot profiles.
Immediately, it’s clear that Gobert, Ayton, and Green are strong deterrents at the rim. Giannis seems to deter everything within 10 feet all together which is insane. Teams shoot much less in the restricted area with them on the court. Both Gobert’s and Green’s shot profiles show upticks in midrange shots and lower rates of 3-pointers, making them the ideal modern defenders. Alternatively, Jarrett Allen’s and Jaren Jackson Jr.’s teams give up more shots at the rim but deter the other close range shots perhaps and 3-pointers because these two are such potent shot blockers.
Comparing this to the previous chart, it looks like offensive players pick better shots against Gobert when they do get to take shots at the rim. This does not mean Gobert didn’t directly challenge them. This might mean he was pulled away from the rim often and the secondary Jazz rim defender did not do a great job rotating. This may also be the case for Draymond Green and Williams III. Where Allen and JJJ may intentionally give up a lot of shots at the rim, their team makes up for it by effectively challenging.
The most interesting ones here to me are Bam and Timelord’s profiles. Their teams have shot profiles that are roughly the same as the league rates but effectively defends just about everywhere on the court. This could signal how strong their overall team defense is thanks to Bam’s defensive versatility and Williams III’s ability to be everywhere.
Who’s most important to his team’s defense?
Despite the Jazz acquiring Hasan Whiteside to cover the rim when Gobert sits, players clearly do not see the backups as the same threat. The Jazz simply do not have a great defense when Gobert sits, and it shows in their shot profile. Similarly, Philly’s defense seems to tank even harder when Embiid sits. Embiid’s profiles show more shots at the rim and more high quality 3-pointers.
Surprisingly, it looks like Cleveland’s defensive identity completely changes without Allen because there is no longer a strong rim protector on the floor. So it looks like they would rather pack the paint and allow more threes, but it doesn’t seem to work well. Opponents shoot higher form most areas of the court when Allen is off the floor.
Thoughts
I was very surprised at how well this illustrated the importance of Gobert and Bam to their teams. This might mean they are two incredible, irreplaceable players. I included Jokic to see what impact or lack of impact he was having with all this chatter about his improved defense. I feel these illustrate Bam, Draymond, and Jaren Jackson Jr’s value very well. Bam and Draymond are often viewed as the keystones to their strong defenses, and it’s easy to see why. Their teams defend at an above average rate and deter easy shots at the rim with them on the court.
So what do you see? Did I miss something? Does something look off in the data or the presentation?
Link to query: https://www.nba.com/stats/players/defense/?sort=DEF_WS&dir=-1&CF=GP*GE*50:MIN*GE*12&Season=2021-22&SeasonType=Regular%20Season&PerMode=Per100Possessions
https://github.com/swar/nba_api
https://www.visualnoise.io/southern-shot-blotting/


